موقع حكومي رسمي تابع لحكومة المملكة العربية السعودية




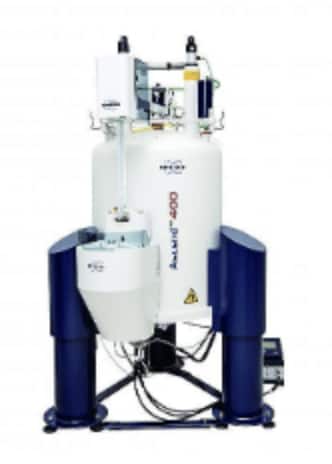
Bruker NMR 400MHz is an indispensable tool in chemistry. From structure elucidation and verification to monitoring of reactions, organic chemistry cannot be imagined without this powerful analytical method. In other areas of chemistry, NMR provides rare insight into such aspects as structure of catalysts, the state and reactions
- H1 & C13 and other different nuclei such as 31P, 29Si, 27Al, 15N in 1D experiment
- Analyzing DEPT C13 experiment
- Studying the molecule structure by 2D experiment using COSY, HSQC & NOESY
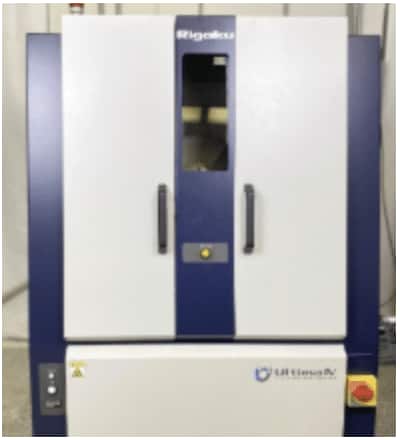
X-ray Diffraction (XRD) is the basic technique for obtaining information on the atomic structure of crystalline solids and is one of the key standard laboratory techniques. XRD is based on the interference of X-ray waves elastically scattered by a series of atoms orientated along a particular direction in a crystal characterized by a vector Ah
The waves scattered by two atoms a and b interfere constructively when the path difference (PQR) is equal to an integer number of wavelengths: PQR = hλ
This condition is valid for orientations K of the scattered waves which satisfy the Laue condition: Ah = h(K1 − K0)
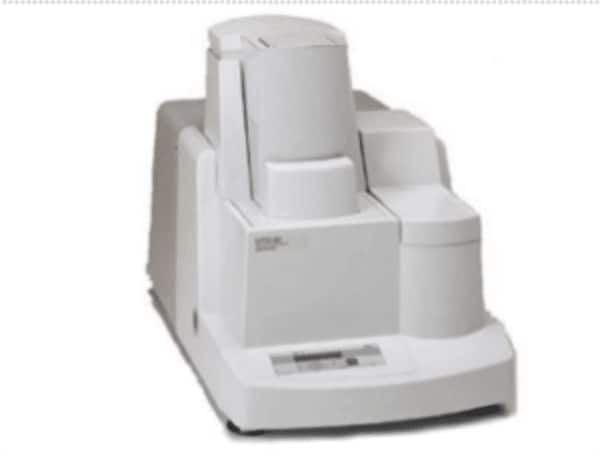
Thermal analysis is the study of changes in a property of a sample that are related to an imposed change in temperature. The sample is usually in the solid state, and the changes that occur upon heating include melting, phase transition, sublimation, and decomposition
The analysis of the change in the mass of a sample during heating is known as Thermogravimetric Analysis (TG). TG measures mass changes in a material as a function of temperature (or time) under a controlled atmosphere. Its principal applications include measurement of thermal stability and material composition; TG is particularly useful for studying dehydration, decomposition, desorption and oxidation processes
The most widely used thermal method of analysis is Differential Thermal Analysis (DTA). In DTA, the temperature of a sample is compared with that of an inert reference material during a programmed temperature change; the temperatures remain equal until a thermal event occurs, such as melting, decomposition or a change in crystal structure
If an endothermic event occurs within the sample, the temperature of the sample will lag behind that of the reference, resulting in a minimum on the curve. Conversely, if an exothermic event occurs, the temperature of the sample will exceed that of the reference, producing a maximum on the curve
The area under the endothermic or exothermic peak is related to the enthalpy of the thermal event (ΔH). For many applications, it is advantageous to use both DTA and TG, since DTA events can then be classified into those that involve mass change and those that do not